
Weather education platform guide
What Is WeatherSTEM and What Can You Do With It?
WeatherSTEM combines local weather stations, live data, cameras, alerts, and education tools. The current platform also serves safety and operational decisions beyond the classroom.
Quick answer WeatherSTEM is a commercial weather-monitoring and education platform built around local stations and web-accessible data. A station page can provide current conditions, archived observations, charts, cameras, forecasts, and alerts depending on the installation. Schools can use the same live data in standards-aligned lessons and data exercises.
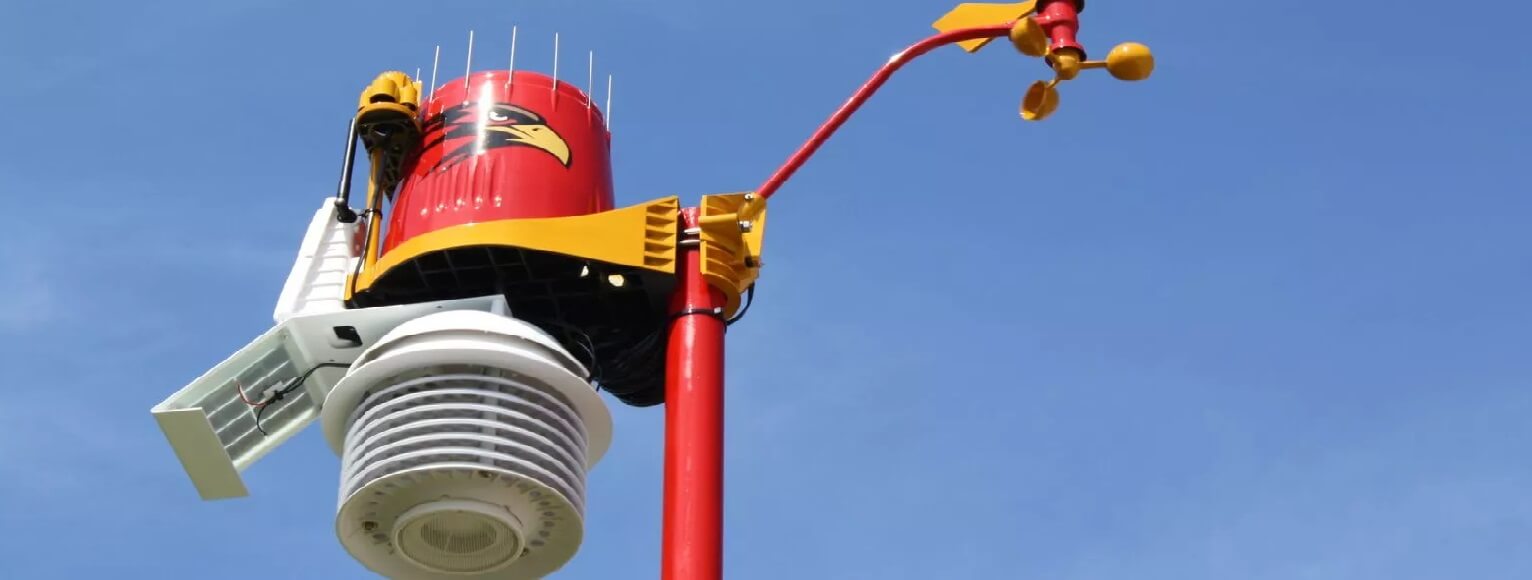
What a WeatherSTEM installation includes
The exact package varies by customer. WeatherSTEM's current company site describes weather stations, lightning detection, high-definition cameras, outdoor warning, air-quality monitoring, alerts, and mesonet management. Its learning materials describe the traditional station as an integrated sensor suite, local console or connection, and a hosted station page.That distinction matters: WeatherSTEM is not just one model of consumer weather station. It is a hardware, data, alerting, and service platform configured for schools, universities, athletics, emergency management, facilities, and public venues.How to use a WeatherSTEM station page
- Choose the correct location. Confirm the school, campus, venue, or county rather than relying on the closest name.
- Check the observation time. Current conditions are useful only when the timestamp is current.
- Open the sensor and metadata details. Identify which variables that installation actually measures.
- Use charts for context. A trend often explains more than one current value.
- Export or record data with units and time zone. Preserve the station identity and interval with any analysis.
What students can learn
- Graph temperature, humidity, pressure, wind, and rainfall through a weather event.
- Compare two stations and explain differences in elevation, exposure, or land cover.
- Calculate rates of change, daily range, rainfall totals, and wind statistics.
- Connect cloud-camera images to measured conditions.
- Practice data quality by finding gaps, stale values, and suspicious spikes.
A practical WeatherSTEM data workflow
Begin with a question that the available station can answer: for example, how temperature changed as a front passed, whether rainfall intensity differed across two campuses, or how a sunny and cloudy day affected the daily temperature range. Open the specific station page and record its station identity, location, observation time, and available sensors before looking at the graph. This prevents a visually interesting chart from being separated from the site that produced it.
- Select the station and variable. Confirm the station ID and choose only sensors installed at that site.
- Define the time window. Record the beginning, end, time zone, and whether the values are samples, averages, peaks, or accumulations.
- Export without discarding context. Keep column names, units, timestamps, and station identity with the downloaded data.
- Check the observation continuity. Mark gaps, duplicate timestamps, stale reports, and abrupt changes before calculating statistics.
- Compare the readings thoughtfully. Account for elevation, surface, sensor height, distance, and observation interval when using another station.
- State the result and its limit. Describe what the selected station observed, not what an entire county necessarily experienced.
Separate observation, forecast, and warning. A station reports conditions at its instruments. A forecast estimates future conditions for an area. An official warning communicates a hazard and protective action. They can inform one another, but they are not interchangeable.
For classroom work, keep the raw export unchanged and perform cleaning or calculations in a copy. Cite the station and access date in the finished graph or report. This creates an auditable path from the local instrument to the claim and makes it easier for another class to repeat the analysis with a different event.A useful final check is to compare the graph with independent context such as an NWS event summary, radar loop, or nearby station—without forcing them to match. Agreement can support the interpretation. A difference can become the lesson. It may reveal a local shower, sensor exposure, a different averaging interval, or a data gap that deserves explanation.Important limits of local station data
Hyperlocal data is valuable precisely because it describes one exposure. A roof-mounted sensor, athletic field, urban courtyard, or open rural site may differ from an airport or a neighborhood a few miles away. Before using a value in a report, check siting, height, maintenance, calibration, timestamp, units, and missing-data flags.Do not treat one private station as an official warning source. Use National Weather Service warnings and public-safety instructions for hazardous weather decisions. A local station can add context but does not replace an official warning.
WeatherSTEM, mesonets, and home stations
| Option | Best for | Key difference |
|---|---|---|
| WeatherSTEM | Hosted local monitoring, education, alerts, cameras, and organizations | Commercial platform and managed services |
| Public mesonet | Regional environmental monitoring | Coordinated network with a public or research mission |
| Home weather station | Owner-controlled backyard observations | Lower cost and local control, siting and maintenance are the owner's job |
| ASOS/AWOS | Aviation and official surface observations | Standardized airport network |