
How to Read a Weather Station Model
Learn how to decode the temperature, dew point, wind, pressure, sky cover, and present-weather symbols packed into a station plot.
A station model—also called a station plot—is a standardized snapshot of weather observations at one location and time.
This beginner guide focuses on the most common surface station-model elements. Fuller plots may also include past weather, precipitation totals, cloud types, cloud-base height, or station identifiers. Always use the map’s legend for its exact layout and units.
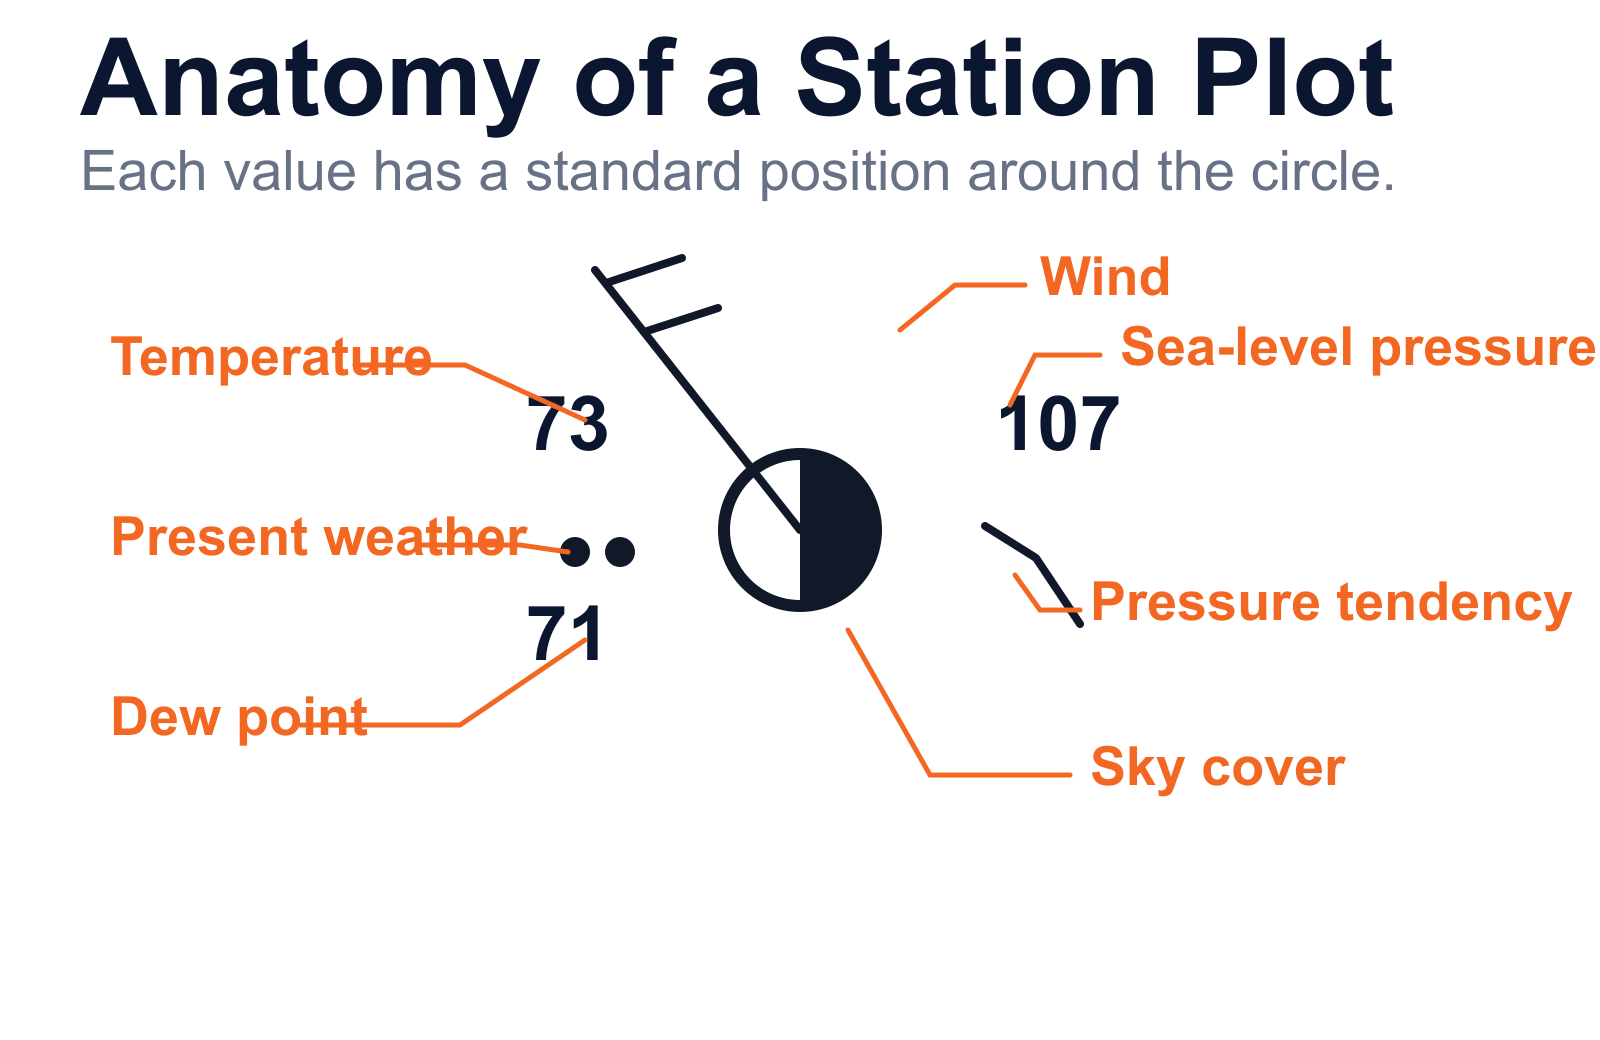
Station plot reference
| Element | Where to look | How to read it |
|---|---|---|
| Temperature | Upper left | Air temperature at observation time |
| Dew point | Lower left | Moisture indicator, compare with temperature |
| Wind | Shaft and barbs | Direction the wind comes from and speed |
| Pressure | Upper right | Restore the leading digits and decimal |
| Pressure tendency | Right of circle | How pressure changed during the previous three hours |
| Sky cover | Center circle | Approximate fraction of sky covered |
| Weather | Left of circle | Rain, snow, fog, storms, and more |
| Visibility | Left of weather symbol | Distance visible, confirm the units in the map legend |
Read the symbols in a consistent order
Start at the center, then work around the plot. Units and the elements displayed can vary by map and country, so check the map legend whenever one is available.
Start with sky cover
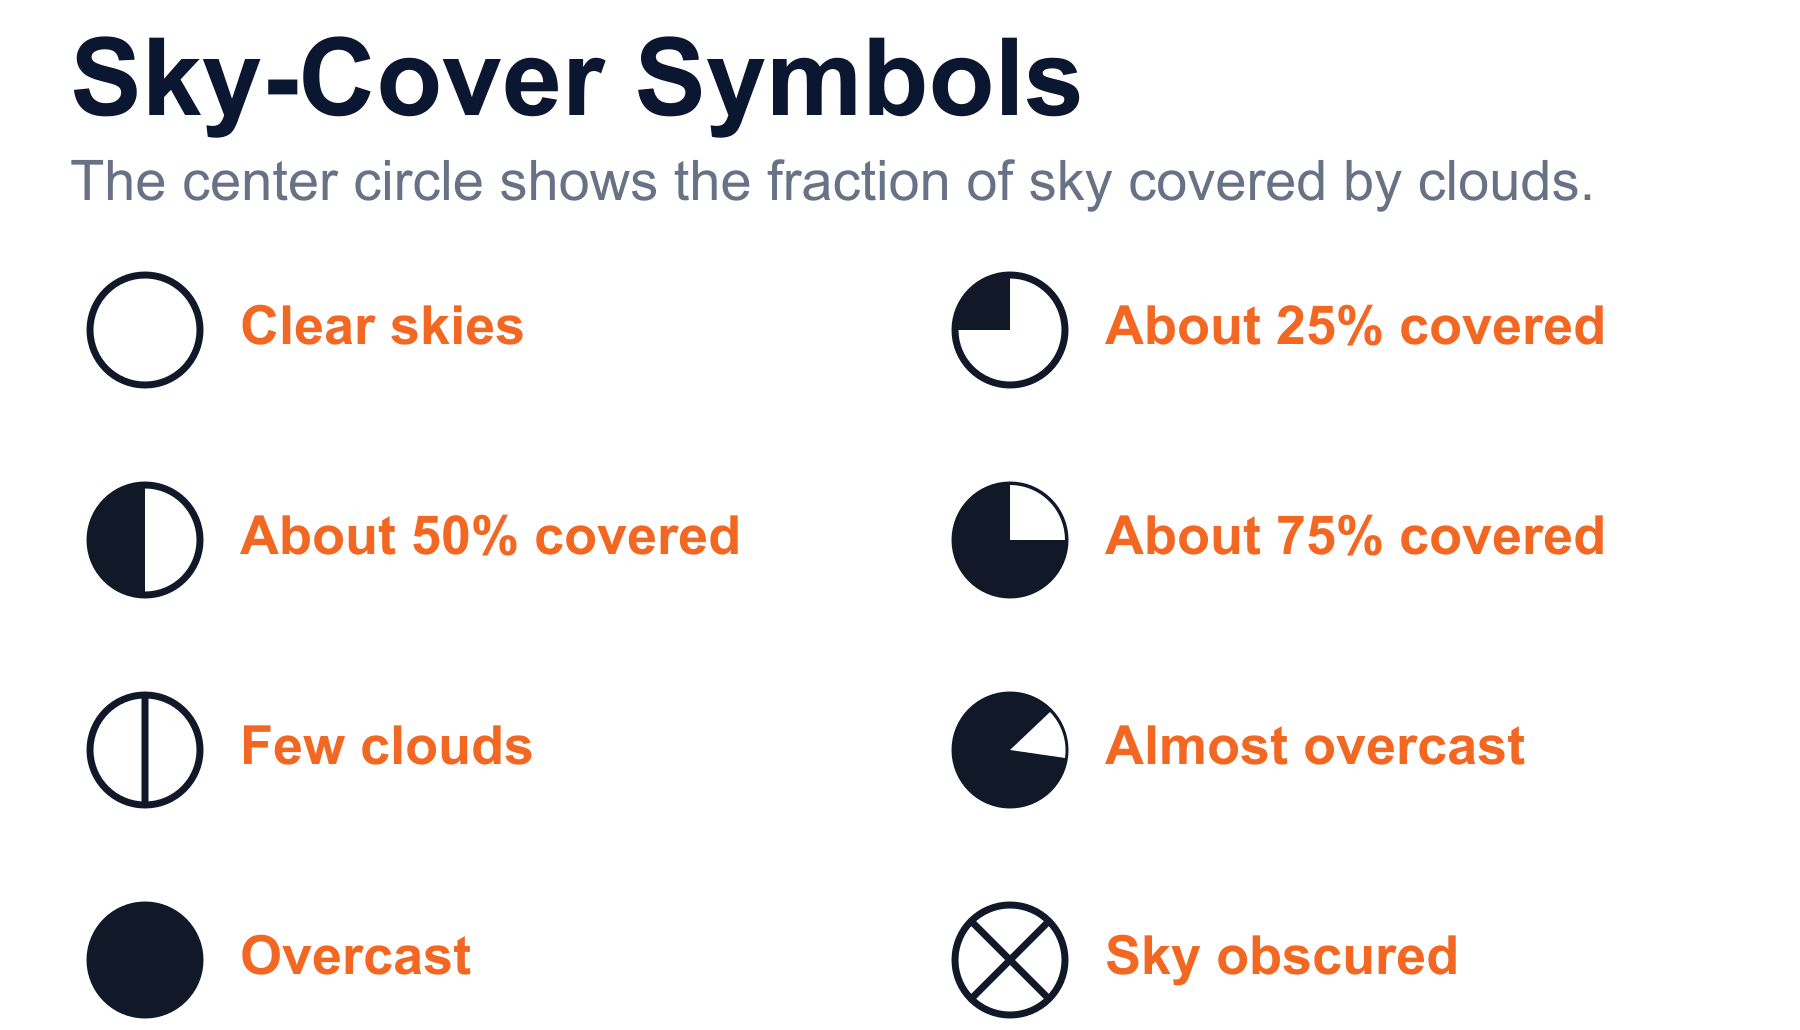
The center circle marks the observation location and shows the approximate fraction of the sky covered by clouds. An empty circle generally means clear skies, progressively filled circles indicate increasing cloud cover, and a filled circle means overcast. A separate symbol may be used when the sky is obscured.
Compare temperature and dew point
Air temperature appears at the upper left and dew point at the lower left. Dew point is the temperature to which air must cool to become saturated, assuming pressure and moisture remain constant.
The smaller the temperature–dew point spread, the closer the air is to saturation and the higher the relative humidity generally is.
Read wind direction and speed
The wind shaft extends from the center toward the direction from which the wind is blowing. A shaft extending northwest of the circle therefore shows a northwesterly wind.
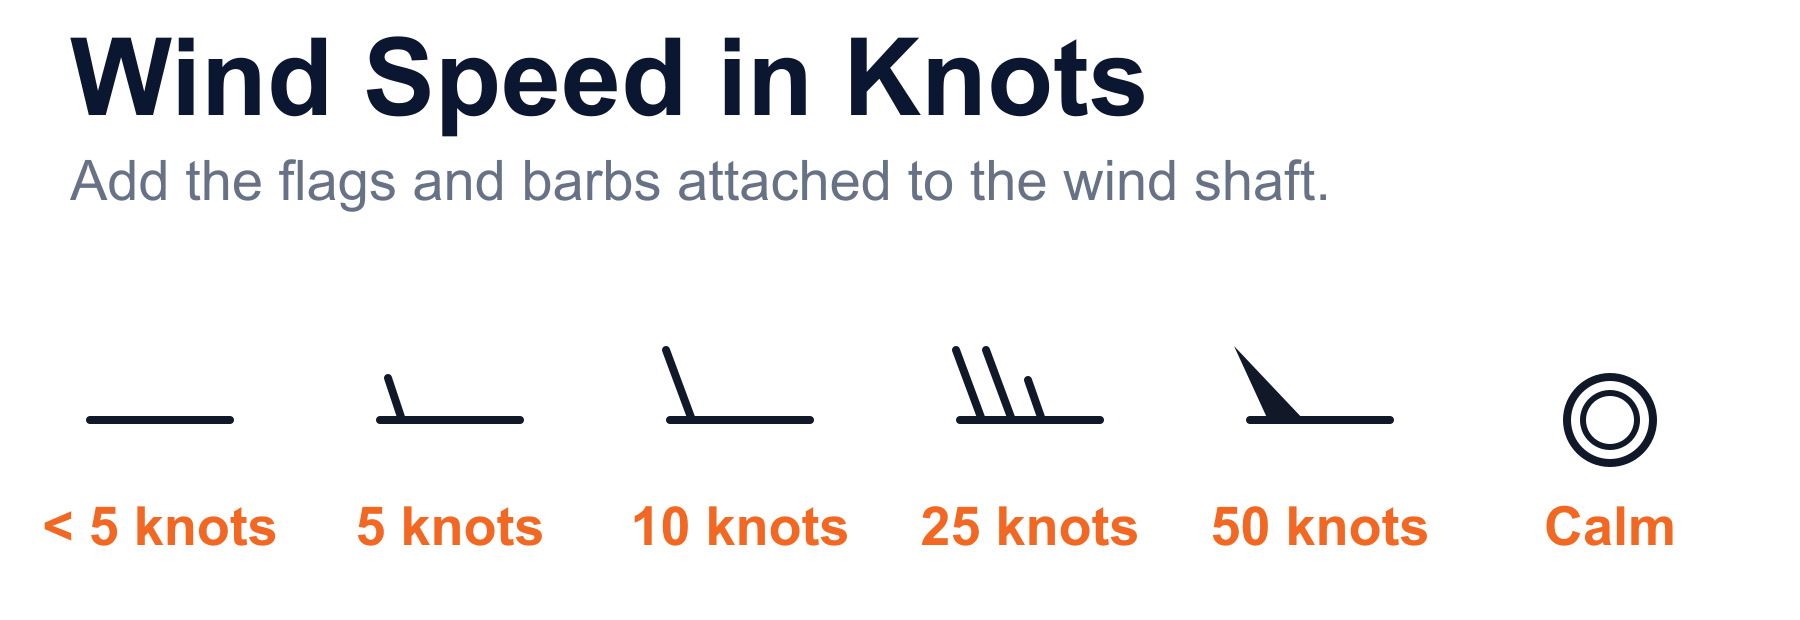
A triangular flag equals 50 knots, a full barb equals 10 knots, and a half barb equals 5 knots. Add the marks together. Calm wind is normally shown without a shaft.
Decode sea-level pressure
Sea-level pressure is plotted in tenths of a millibar, numerically equivalent to a hectopascal. The leading 9 or 10 and the decimal point are omitted.
Add the leading digits that produce a realistic value closest to 1000 mb: 103 becomes 1010.3 mb, while 872 becomes 987.2 mb.
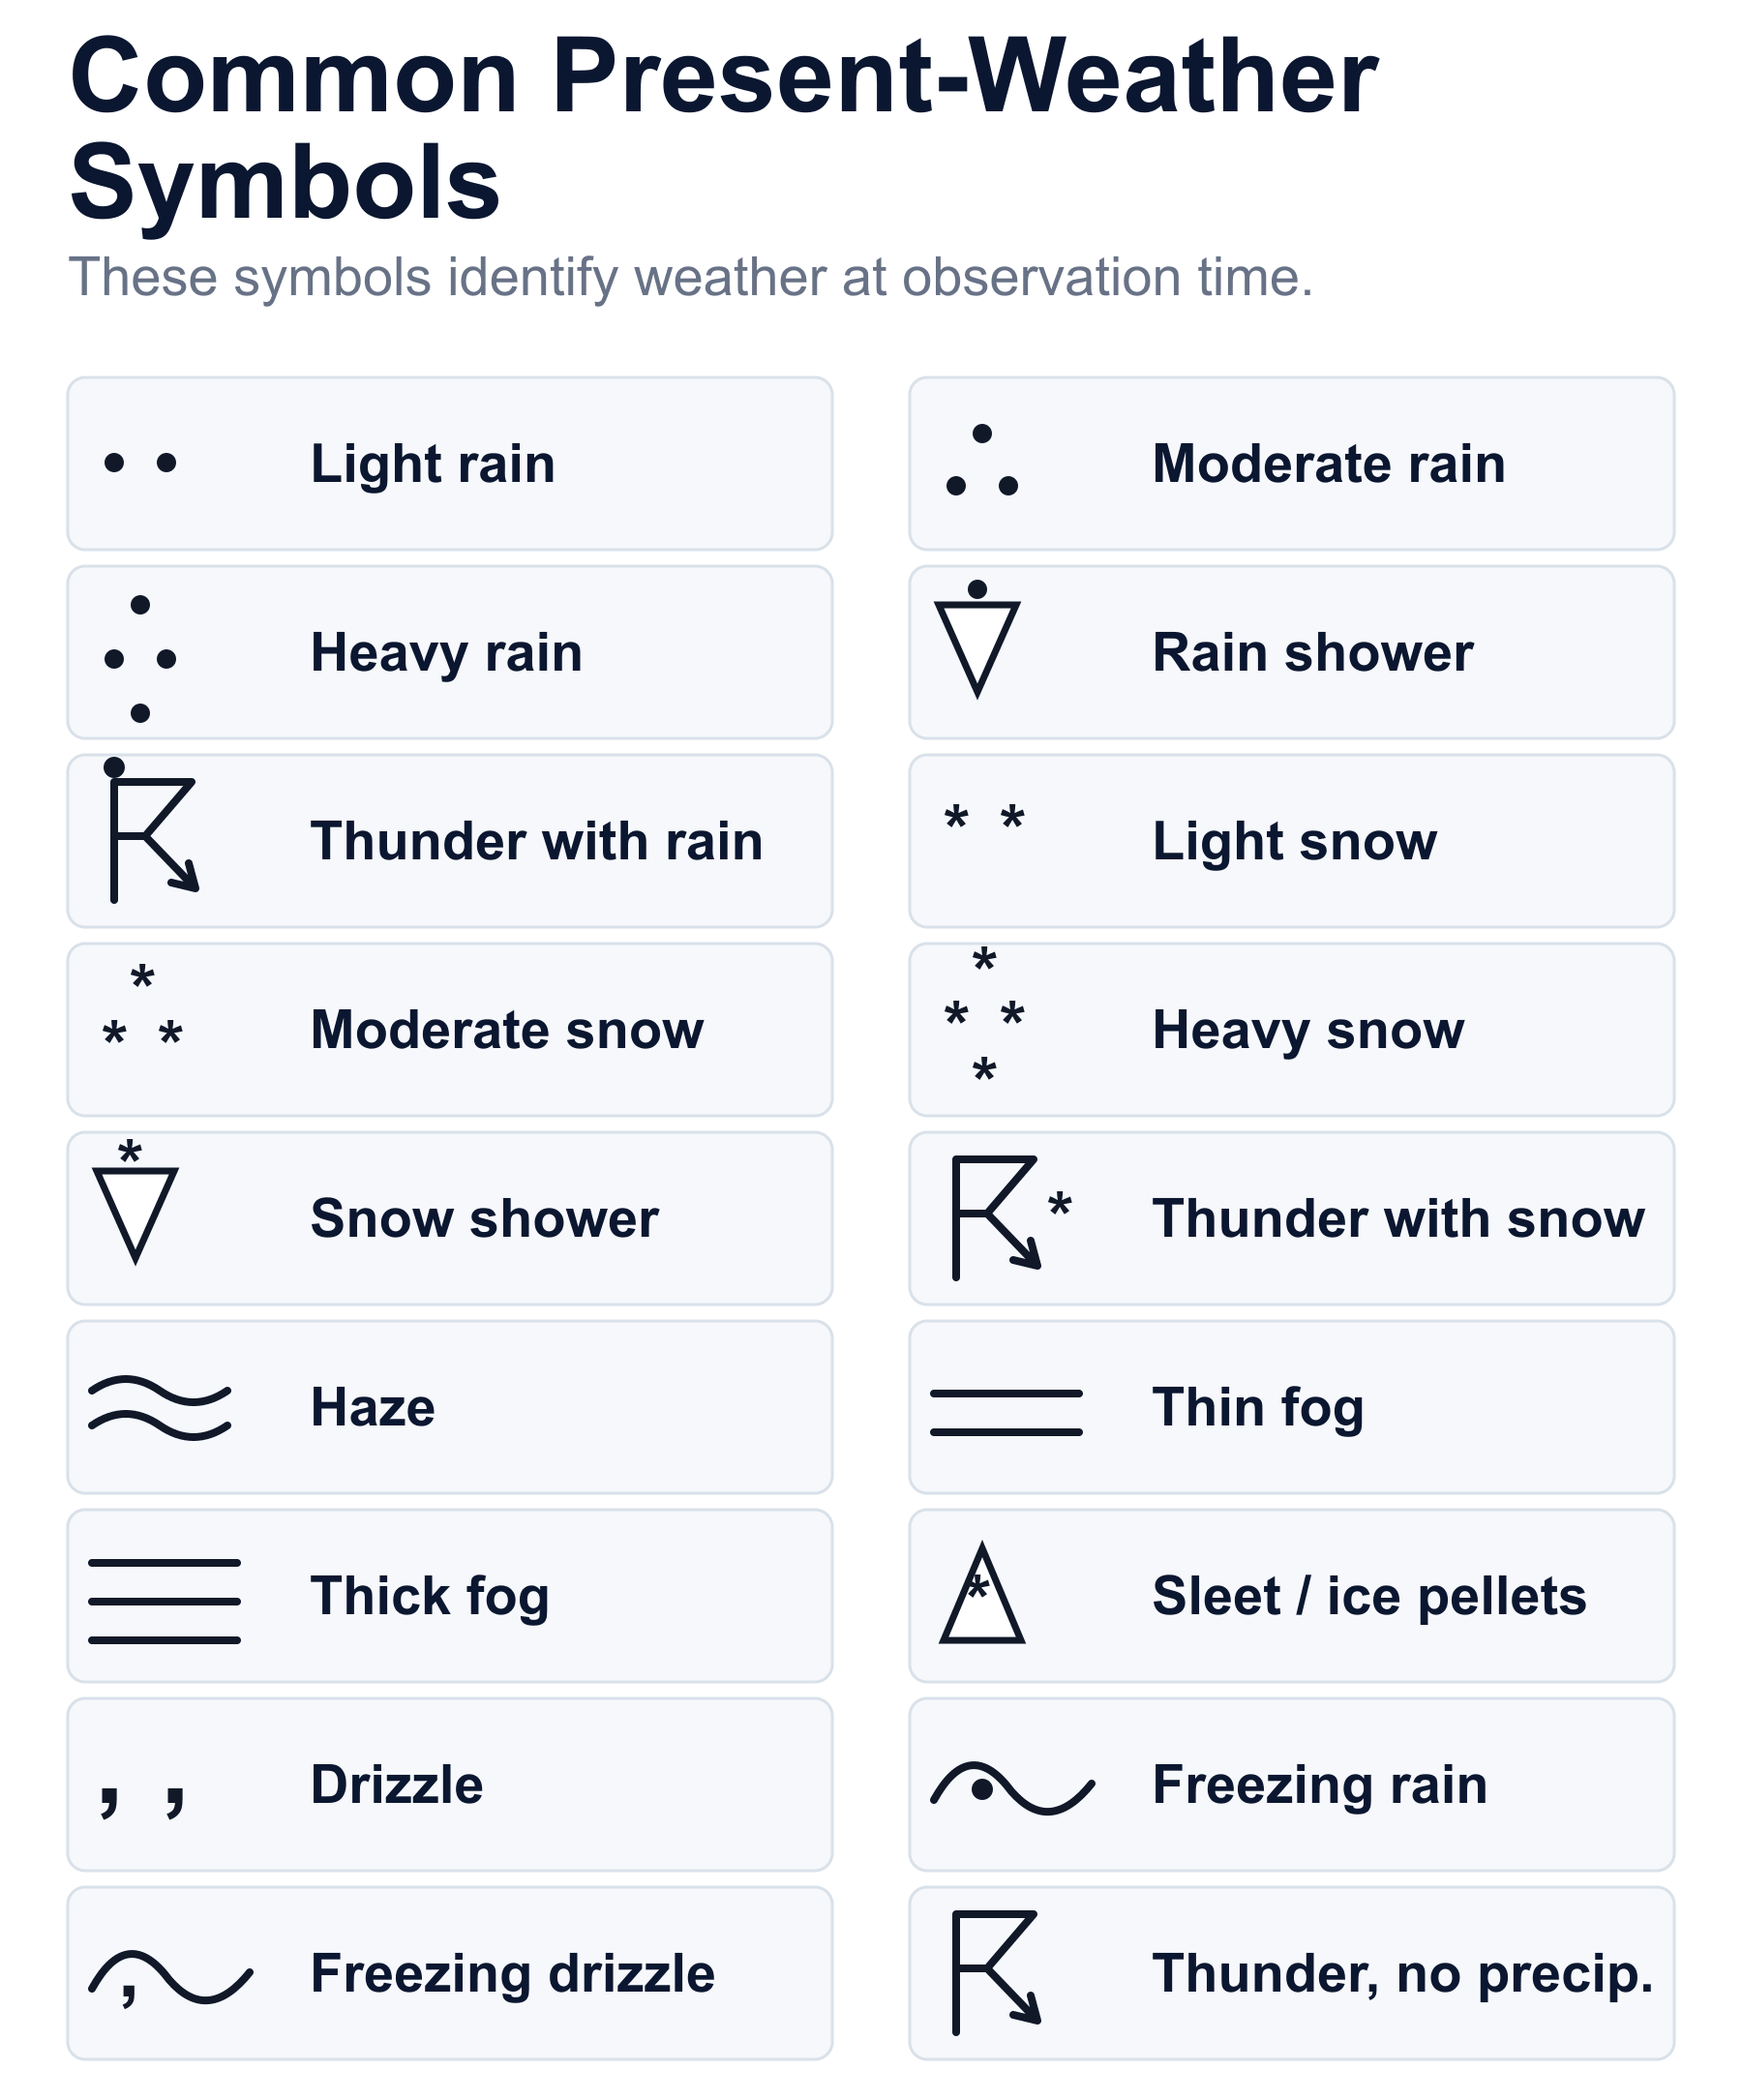
Identify present weather
The symbol to the left of the center circle reports weather at the observation time. In this simplified key, dots represent rain and asterisks represent snow. The count increases with intensity: two symbols indicate light precipitation, three moderate, and four heavy.
Other symbols identify fog, thunderstorms, drizzle, showers, and additional conditions. Symbol sets can vary, so use the map’s legend.
Look for visibility
Visibility is commonly plotted to the left of the present-weather symbol. It reports how far an observer can see through fog, precipitation, haze, or other obscurations.
Not every map displays visibility. A missing value may mean the observation was unavailable or omitted—not that visibility was zero.
Check the three-hour pressure tendency
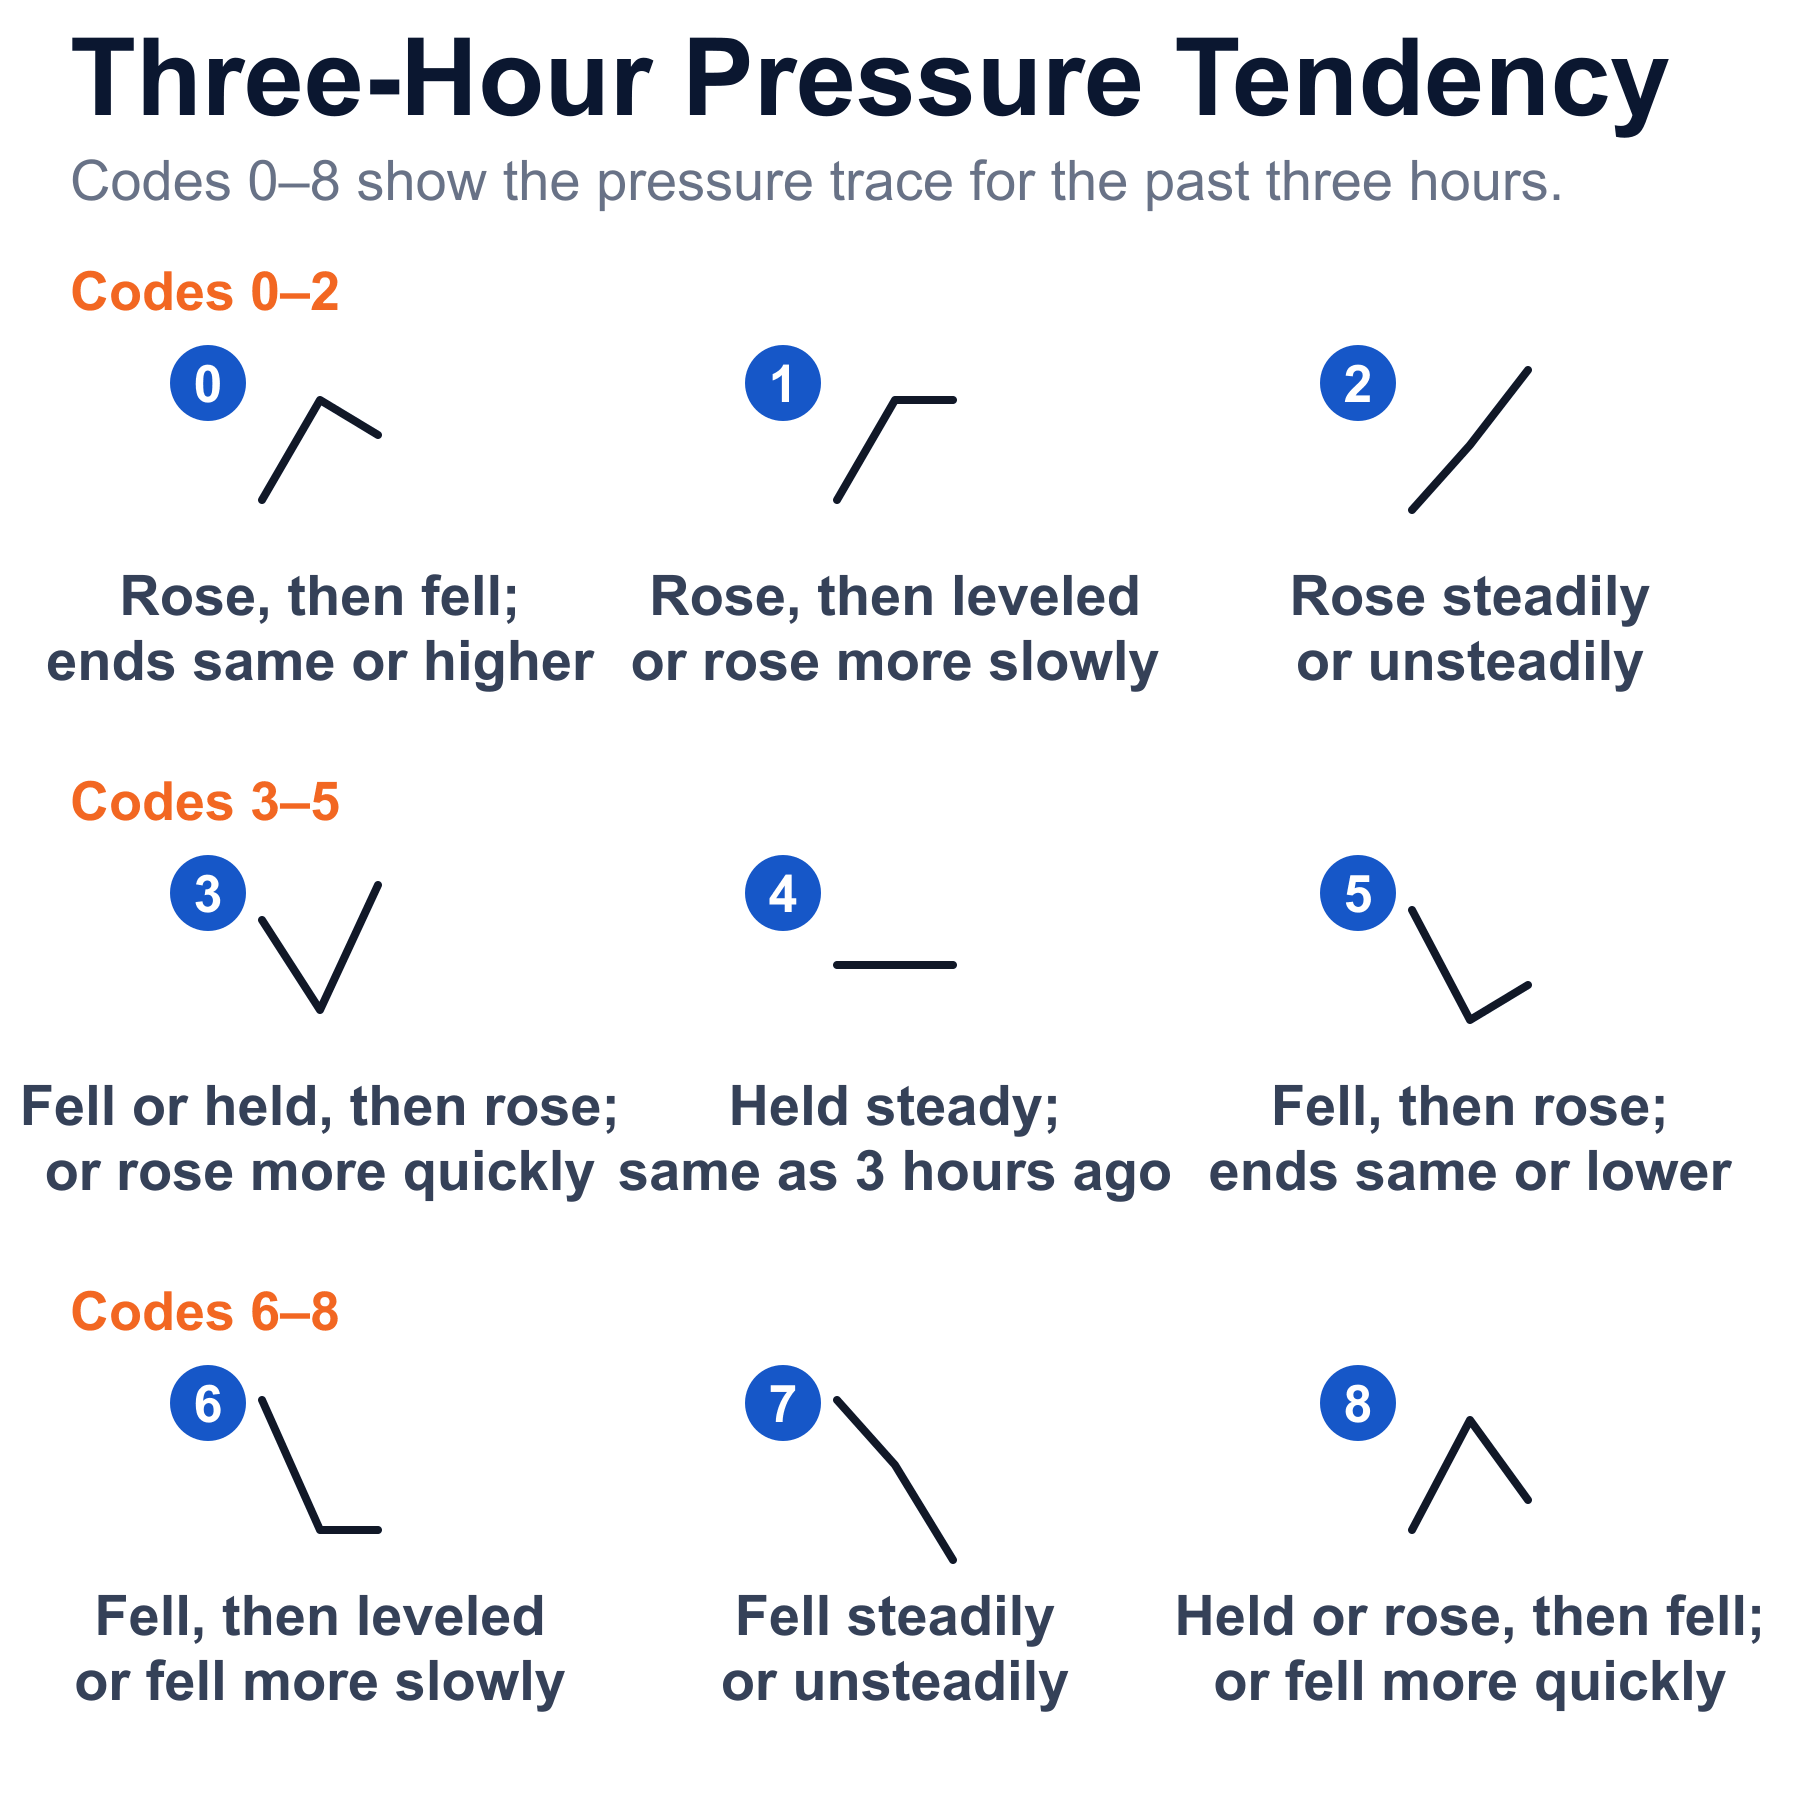
The pressure-tendency symbol shows whether pressure rose, fell, or changed direction during the previous three hours. When a number appears beside it, that number gives the amount of change in tenths of a millibar.
Pressure tendency adds context to the current pressure reading. Falling pressure can accompany an approaching system, but a single symbol is not a forecast by itself.
Worked example: decode the sample plot
Now read the labeled example near the top as a complete observation rather than a collection of isolated symbols.
- Temperature: 73 appears at the upper left.
- Dew point: 71 appears at the lower left. The two-degree spread indicates very moist air close to saturation.
- Wind: The shaft extends northwest of the circle, so the wind is from the northwest. Two full barbs indicate 20 knots.
- Pressure: 107 becomes 1010.7 mb after restoring the leading digits and decimal.
- Sky cover: The half-filled circle indicates roughly half the sky is covered.
- Present weather: Two dots indicate light rain in this symbol set.
- Pressure tendency: The trace shows falling pressure during the prior three hours.
Common mistakes to avoid
Practice reading station models
Use this order until the layout becomes familiar:
- Check sky cover in the center circle.
- Read temperature at upper left and dew point at lower left.
- Follow the wind shaft toward the direction the wind comes from, then add the barbs.
- Decode sea-level pressure at upper right and review the three-hour tendency.
- Identify present weather and visibility to the left of the circle.
For more practice, compare the NOAA Weather Prediction Center station-model examples with current plots in the Aviation Weather Center’s Graphical Forecasts for Aviation.
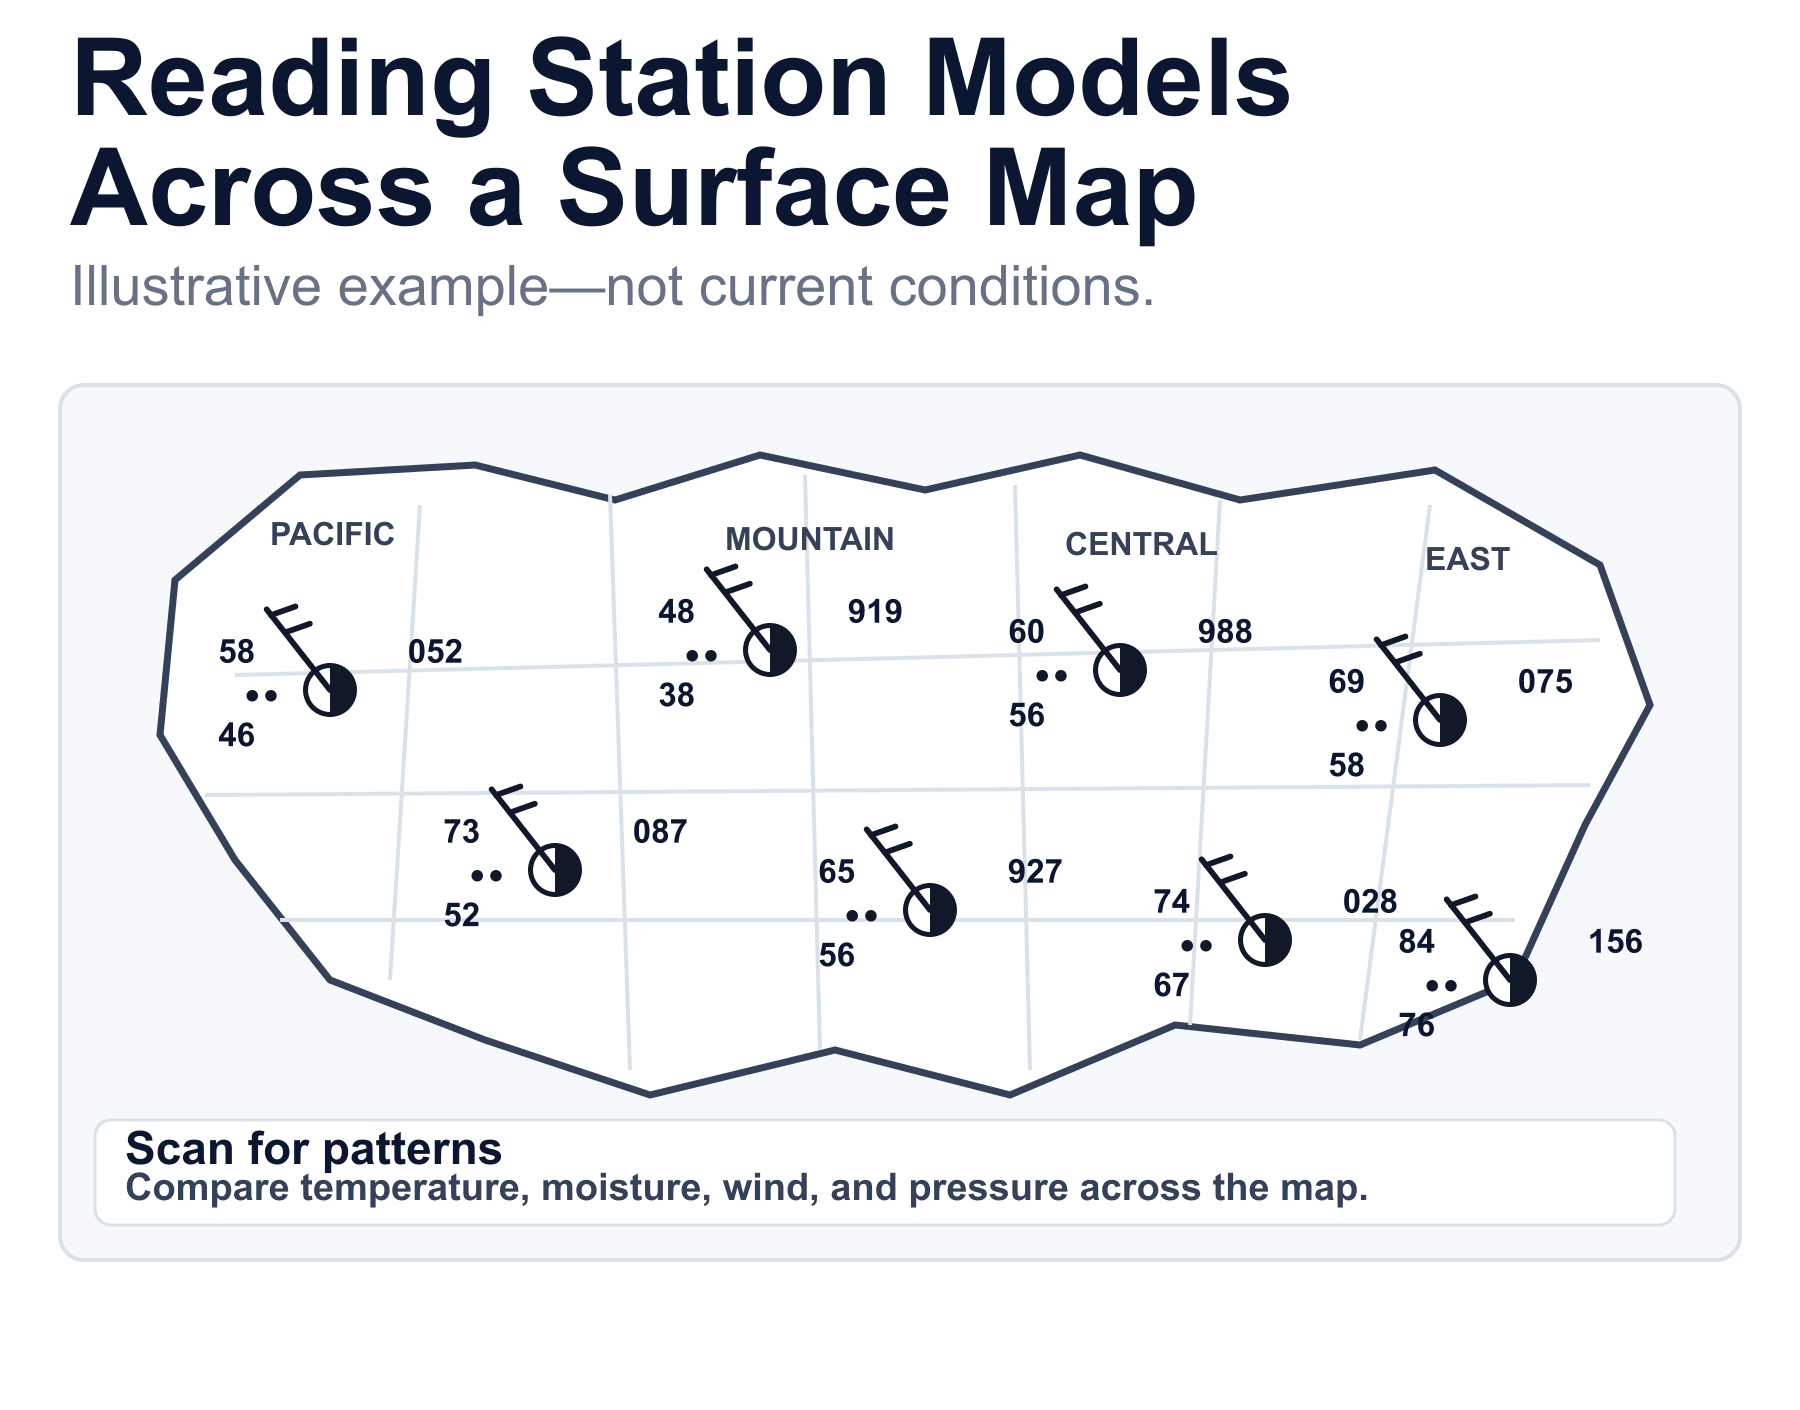
Station models on a surface weather map
Once you can read one station plot, you can scan a full surface map to compare conditions across many observation sites. Each compact cluster uses the same basic positions and symbols.
Frequently asked questions
What is a station model?
A station model is a compact, standardized plot of weather observations recorded at one place and time.
How do you read wind direction on a station model?
Follow the shaft from the center circle. It extends toward the direction the wind comes from. The attached flags and barbs show speed.
How do you decode three-digit air pressure?
Add a leading 9 or 10 and place the decimal before the last digit, choosing the realistic sea-level pressure nearest 1000 mb.
What does the center circle show?
The center circle generally shows the approximate fraction of the sky covered by clouds at the observation site.
Why are some station-model symbols missing?
The observation may not include that element, or the map may omit it for clarity. A missing symbol should not automatically be interpreted as zero.
Is a station model the same as a forecast model?
The answer is no. A station model displays observations from a location and time. A forecast model uses equations and data to estimate future atmospheric conditions.
Sources and further reading
These NOAA resources explain standard station-model symbols and show how the same observations appear in operational weather displays.
NOAA Weather Prediction Center station-model examples — Official examples and explanations of common station-plot symbols.
Aviation Weather Center graphical forecasts — Operational display of surface observations and aviation weather conditions.