
WXObservation learning path
Use forecasts and weather data
Read radar, alerts, historical records, and observation networks with the context needed to interpret weather information well.
8 published guides
Read the product before the picture
Use weather data with its limits in view
Radar colors, forecast icons, station plots, lightning maps, and historical summaries do not all describe the same thing. Each product samples or estimates a particular part of the atmosphere, covers a particular area, and represents a particular time. Knowing the source and timestamp is often more important than studying the map more closely.
This path helps readers interpret weather information without treating any single display as ground truth. You will learn what common systems actually measure, where their blind spots come from, and how to compare remote data with surface observations and official forecast information. The result should be a better question and a better decision, not false precision.
Choose by reader task
Choose a starting point
Start with the type of information you are trying to interpret: a current radar display, a past observation, or a network collecting data near the ground.
How to Look Up Past Weather by ZIP Code or Date
Choose an archive, nearby station, date, and weather variable that match the question you want to answer.Read this guideWhat Is a Mesonet Weather Station?
See what makes a mesonet useful and why siting, maintenance, and quality control still matter.Read this guideComplete article directory
All Use forecasts and weather data guides
Browse every published guide in this path. New articles will appear here as the library grows.
Use forecasts and weather data
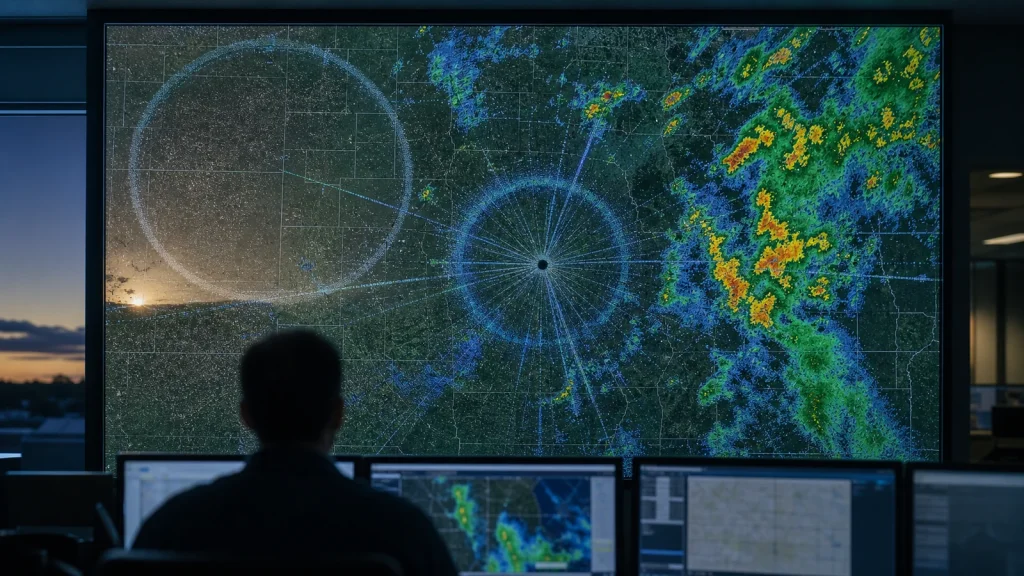
Why Does Weather Radar Show Rings, Circles, and Spokes?
A radar circle is not always rain or a glitch. Compare bird rings, melting snow, storm outflow, and display artifacts with a real radar…
Read guide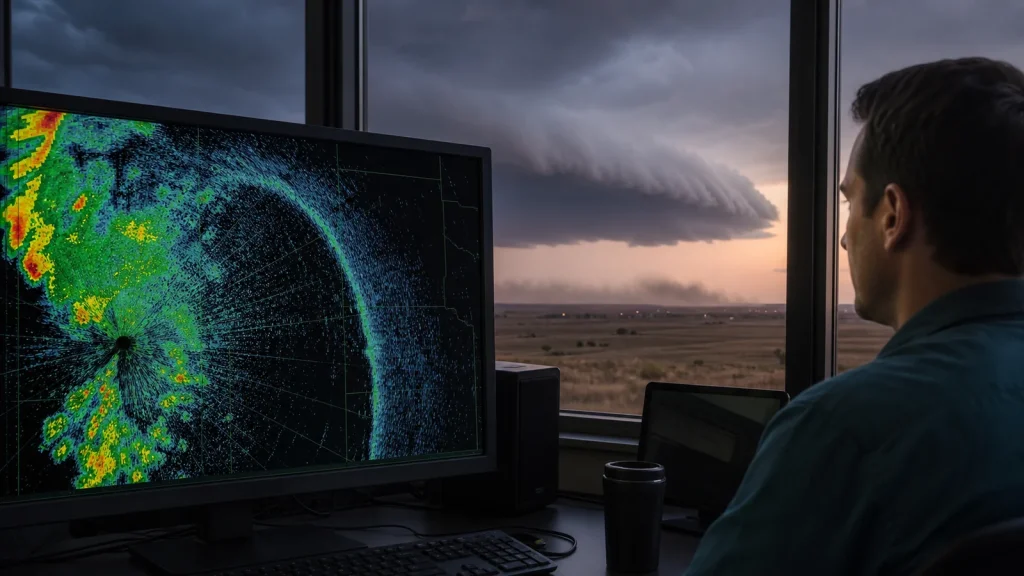
Use forecasts and weather data
Thin Line on Weather Radar: Outflow Boundaries Explained
A thin radar line can mark storm-cooled air moving ahead of the rain. Learn the visual clues, surface changes, and limits with a real…
Read guide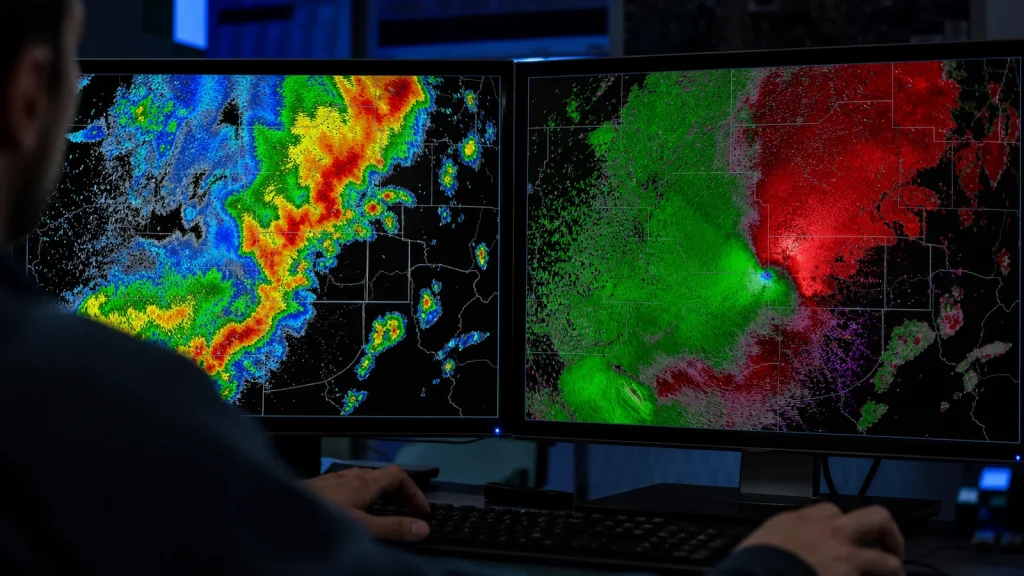
Use forecasts and weather data
Radar Reflectivity vs. Velocity: What Each Product Shows
Learn what dBZ and velocity colors mean, compare base and storm-relative velocity, and recognize radar’s limits at your location.
Read guide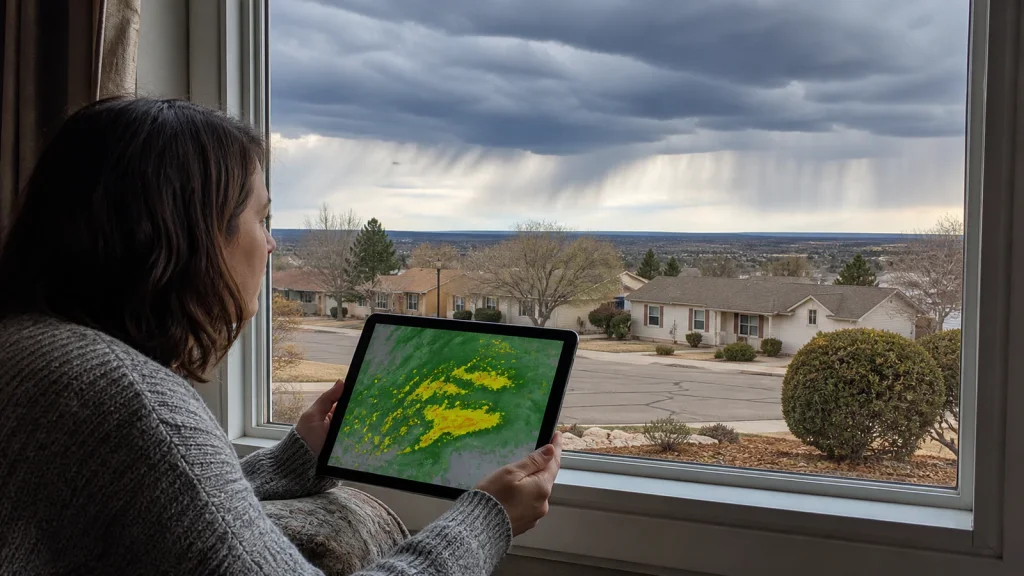
Use forecasts and weather data
Why Radar Shows Rain When It Isn’t Raining
Radar shows rain but the ground is dry? Learn how virga, beam height, drifting precipitation, clutter, and app processing create the mismatch.
Read guide
Use forecasts and weather data
How to Look Up Past Weather by ZIP Code or Date
Find historical temperature, rain, snow, wind, and hourly weather by ZIP code or date using NOAA station archives, with tips for choosing the right…
Read guide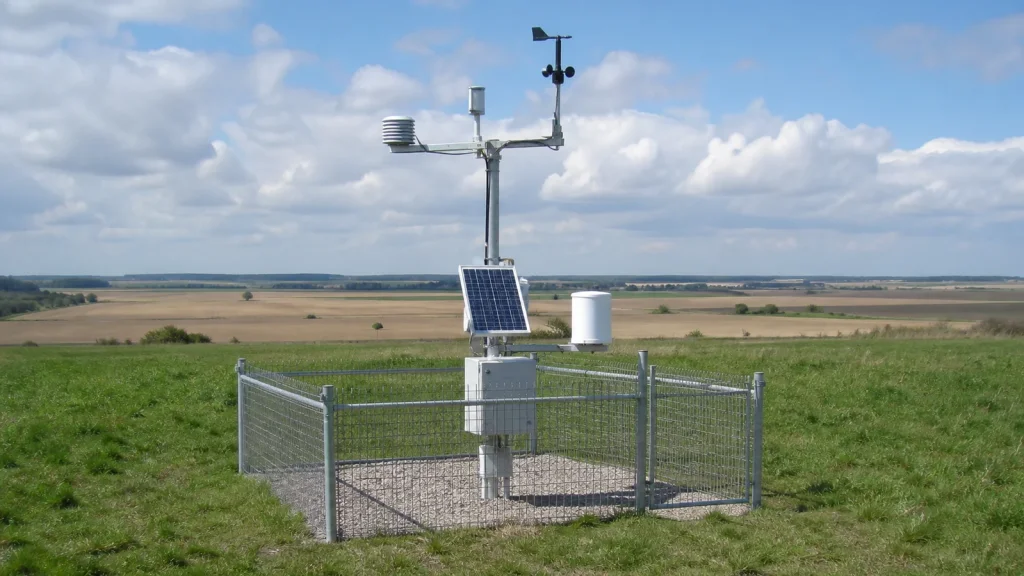
Use forecasts and weather data
What Is a Mesonet Weather Station?
Learn what makes a mesonet different, what its stations measure, how to find nearby data, and how to judge timestamp, siting, and quality.
Read guide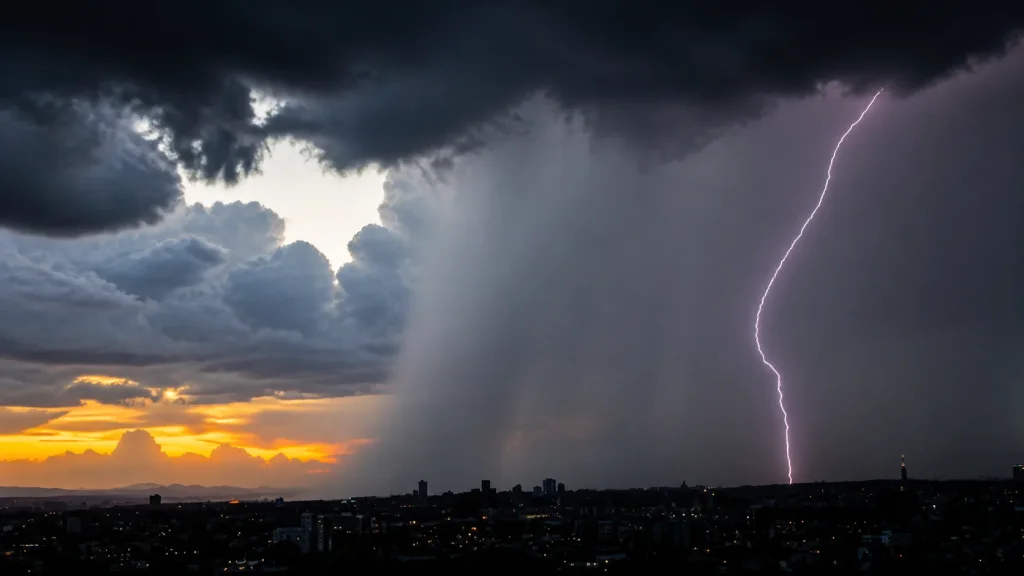
Use forecasts and weather data
How Do Lightning Detectors Work? Ground, Satellite, and Personal Sensors
Learn how ground networks, NOAA satellites, airport sensors, and personal lightning detectors sense and locate lightning, plus their limitations.
Read guide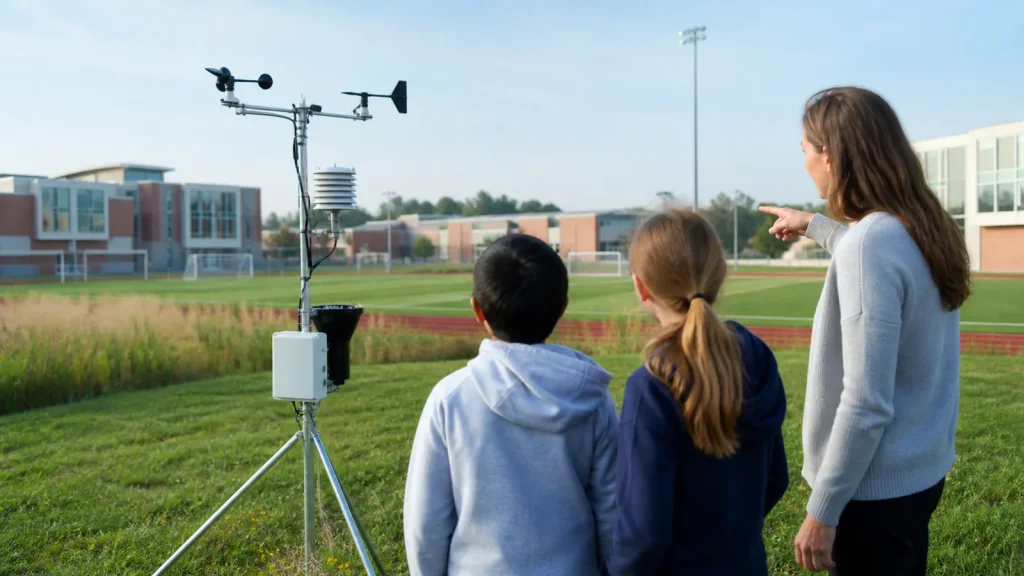
Use forecasts and weather data
What Is WeatherSTEM and What Can You Do With It?
See how WeatherSTEM combines local stations, live data, cameras, alerts, education tools, and managed weather monitoring.
Read guideUse this path well
A three-question check for any weather display
Before acting on a colorful map or precise-looking number, pause long enough to establish what the product represents. This habit prevents many of the most common interpretation errors.
What is being shown?
Identify the variable, units, measurement or estimation method, and whether the display describes past, present, or future conditions.
How current and local is it?
Check the valid time, update interval, nearest observation, coverage gaps, and whether elevation or distance matters.
What can confirm it?
Compare another suitable source, nearby surface observations, what is happening outside, and any official alert or forecast discussion.
Keep learning
From observation to action
Weather data is most useful when it is checked against what is happening at the surface, understood in context, and translated into an appropriate decision. The four learning paths reinforce one another; use them as a cycle, not a required sequence.
Give forecasts a local point of comparison. A home weather station creates a continuous record at your location, helping you compare predicted timing and conditions with what actually happens. Explore home weather stations