
Weather radar field guide
Radar Reflectivity vs. Velocity: What Each Product Shows
Learn what dBZ and velocity colors mean, why red beside green does not automatically mean a tornado, and how to compare radar with conditions at your location.
Quick answer
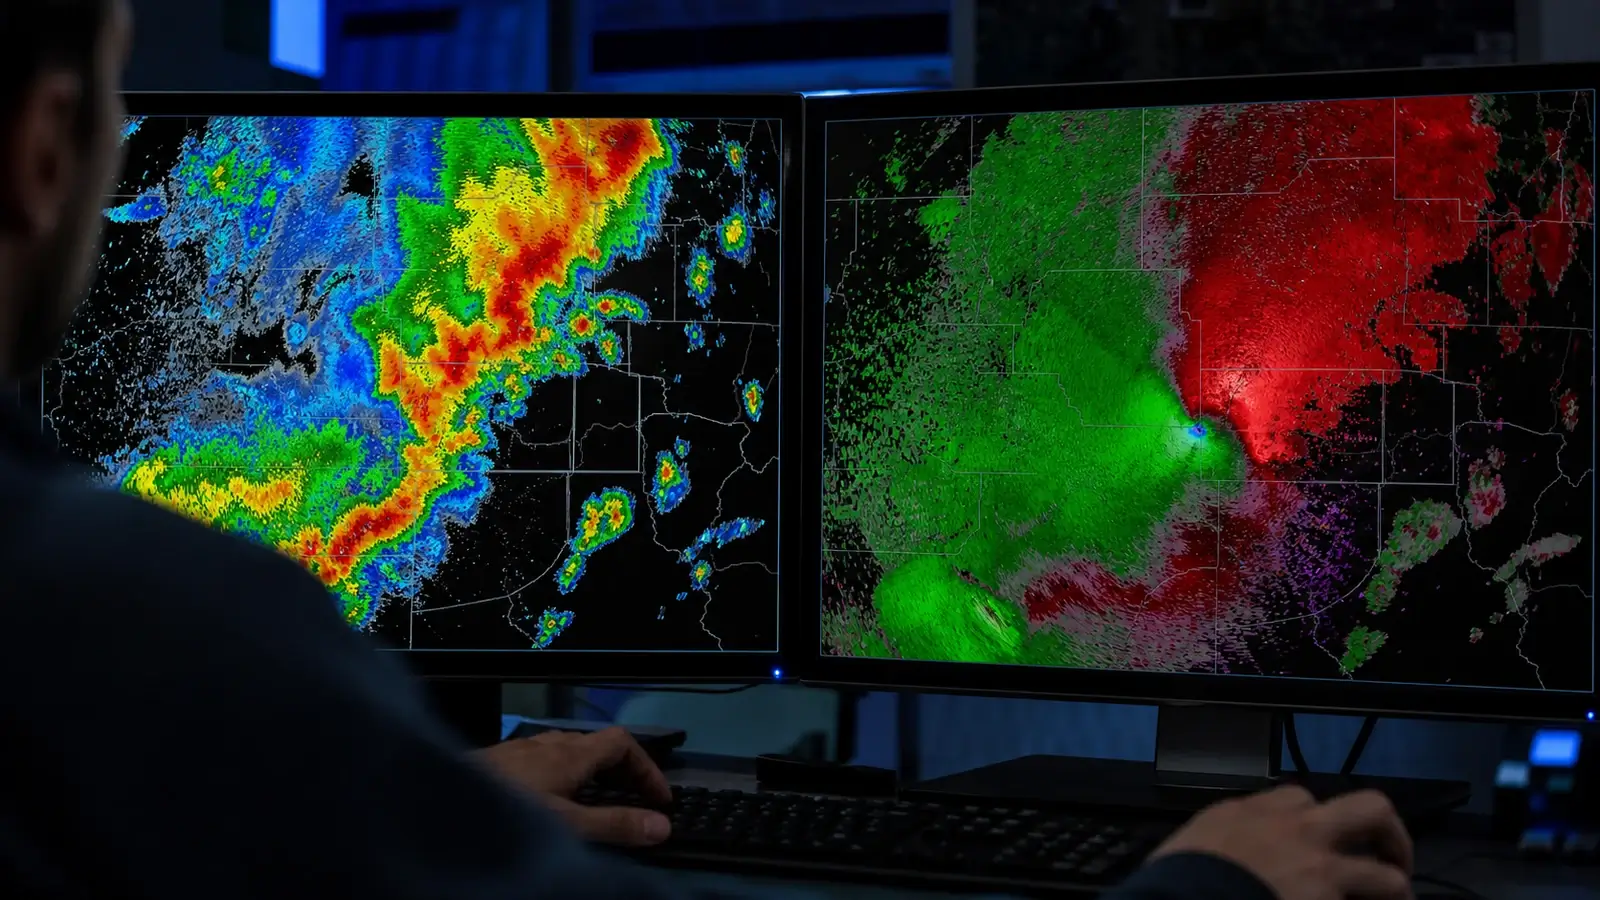
Radar reflectivity shows where targets return energy and how strong those echoes are, usually in dBZ. Radial velocity shows how fast targets move toward or away from the radar, usually in knots, mph, or m/s. Reflectivity helps you locate precipitation and storm structure. Velocity helps you interpret wind patterns. Green commonly means toward the radar and red means away on velocity displays, but the legend controls. Red touching green alone does not prove rotation or a tornado.
Most public radar maps open in reflectivity because it resembles a precipitation map. Severe-weather discussions often switch to velocity, where the colors seem unrelated to rain. The products are built from the same radar pulses but answer different questions: “What is returning energy?” and “How is that target moving along my line of sight?”
Reading them together helps you understand a storm without treating a radar pixel as a measurement at your house. Reflectivity alone cannot measure wind. Velocity alone may have no reliable data where there are too few targets. Both depend on beam height, viewing angle, scan time, and data quality.
Warnings come first. Follow official warning instructions before studying radar. A tornado warning can be based on radar evidence alone. Do not wait for a debris signature, a visible funnel, or personal confirmation. The National Weather Service tornado alert guide explains when to take shelter.
Reflectivity and velocity at a glance
| Product | Read the legend | Useful question | Key limit |
|---|---|---|---|
| Reflectivity | dBZ describes echo strength | Where are echoes, and how is the storm organized? | A strong echo is not a surface rain total or wind measurement |
| Base velocity | Signed speed toward or away from the radar | How are targets moving along the beam? | Cross-beam motion and surface wind can be missed |
| Storm-relative velocity | Radial speed after estimated storm motion is removed | Is a smaller circulation clearer within the moving storm? | The chosen storm motion affects the display |
What reflectivity and dBZ show
Radar transmits energy and listens for a small portion to scatter back. The radar converts that returned power into a reflectivity factor, allowing for factors such as target distance. The display expresses the result on a logarithmic scale called dBZ. Larger and more numerous liquid drops generally produce stronger returns, but target type matters. Hail, melting snow, birds, insects, and ground objects can be bright for reasons unrelated to rainfall rate.
A 10 dBZ increase means a tenfold increase in reflectivity factor, not ten times the rainfall. For example, 40 dBZ represents ten times the reflectivity factor of 30 dBZ. Neither number by itself tells you the rain rate at your driveway. The NWS reflectivity definitions explain why the displayed value is more than raw received power.
Base reflectivity displays one elevation slice, commonly the lowest available tilt. Composite reflectivity takes the highest reflectivity found through multiple elevation angles over a location. A composite can highlight a strong core aloft even when the lowest slice is weaker. Neither view guarantees that the sampled precipitation reaches the ground.
Colors map to dBZ ranges chosen by the display. Green often represents weaker echoes and yellow or red stronger echoes, but palettes differ. A red reflectivity pixel does not mean outbound wind, and a high dBZ value does not prove hail. Our guide to radar showing rain over a dry location explains virga, beam height, and non-weather echoes in more detail.
What radial velocity shows
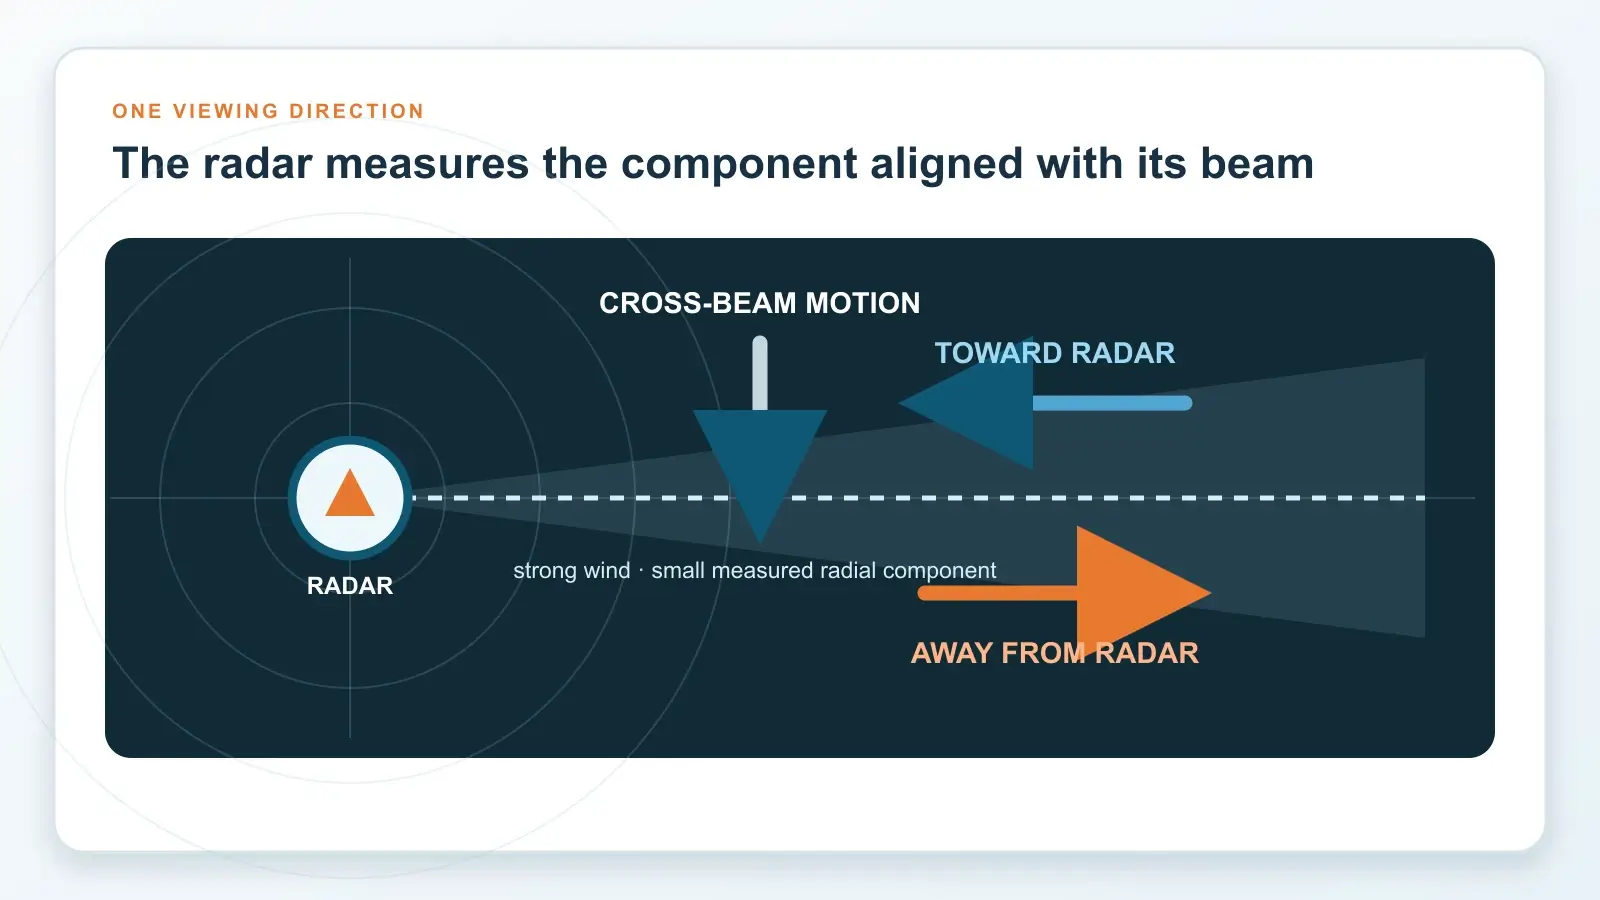
Doppler radar measures the phase change between pulses to estimate motion along the beam. The result is radial velocity: the component moving directly toward or away from the radar. Motion exactly perpendicular to the beam has no radial component. A strong crosswind can therefore appear weak, while a lower-speed wind aligned with the beam appears clearly.
On the conventional U.S. palette, greens and blues are inbound and reds or oranges are outbound. Negative values conventionally mean toward the radar and positive values mean away. These directions are relative to the radar site, not your location or the top of the map. Some applications reverse or customize colors, so the product legend is authoritative.
Velocity needs targets. Rain, snow, insects, dust, and other scatterers move with or partly with the air and make the wind visible. In very clear, dry air there may be too little signal. Non-weather targets and quality-control errors can create misleading values.
Reading broad wind, convergence, divergence, and rotation
A broad environmental wind often produces one large inbound region on the side from which air approaches the radar and one outbound region on the opposite side. For a simple, uniform wind field, the near-zero band passes through the radar where motion is mostly across the beam. Adjacent weak red and green along that band can occur without a rotating storm. Near-zero velocity also does not mean calm air.
Convergence appears when air on two sides moves toward a common boundary. Divergence appears when it spreads from a center. Gust fronts and downbursts can produce these patterns, though orientation to the radar changes their visibility. For a compact divergence pattern viewed favorably, the toward and away signals lie on the near and far sides of the outflow center along the beam. Rotation more often places its pair side by side across the beam. Our microburst versus tornado guide connects these patterns with wind damage and their limits.
For a faint reflectivity line spreading away from thunderstorms, see our guide to radar fine lines and outflow boundaries. It pairs a real radar example with surface clues and explains why a weak echo can still accompany a strong gust.
Rotation can appear as a compact pair of opposing radial velocities, often called a velocity couplet. The actual speeds, spacing, radar-relative geometry, and storm context matter more than the colors touching. Tight spacing and strong shear raise concern, particularly when the pattern persists. A circulation aloft does not automatically reach the ground, and a weak or absent signature is not an all-clear.
Base velocity vs. storm-relative velocity
Base velocity shows the radial component of target motion relative to the ground-based radar. It preserves the storm’s translation and is valuable for straight-line wind, environmental flow, convergence, and divergence. When a storm moves rapidly, that translation can dominate the color pattern and make smaller internal circulations harder to see.
Storm-relative velocity removes the radial component of an estimated storm-motion vector from base velocity. That often brings storm-scale rotation, inflow, and outflow into clearer contrast. The result is not a new measurement. It is a transformed display built from base velocity and an assumed motion. If the selected motion is wrong or the storm is reorganizing, the pattern can be distorted.
When available, compare both velocity views. A storm-relative value is not a ground-relative wind speed to compare with your anemometer. The NWS radar product guide illustrates how removing storm motion changes the view. Forecasters assess a suspected circulation across scans, elevations, and other products rather than relying on one color pair.
Important limitations and common traps
The beam generally rises above the ground with distance because of its elevation angle and Earth’s curvature. It also widens, blending a larger volume of targets into the measurement. A radar far from a storm may sample several thousand feet above the surface, missing a low-level circulation or measuring wind that never reaches the ground. Nearby terrain can block part of the beam. Heavy precipitation can weaken the signal, with the effect depending on radar wavelength. The NWS explanation of radar sampling shows why viewing distance matters.
A Doppler scan has a maximum unambiguous velocity, often called its Nyquist velocity. Faster radial motion can wrap to the opposite end of the velocity scale. This is velocity aliasing, which is different from an echo appearing at the wrong distance through range folding. Automated correction can fail, creating false couplets or hiding real shear. Isolated extreme pixels and radial streaks should be treated cautiously.
Scans are not simultaneous everywhere and at every height. A radar completes tilts over time. Mosaics combine radars with different scan moments. Storms can change between frames. An app screenshot also may be delayed, smoothed, or based on a derived product rather than the single-site base data you think you selected.
How to compare the products at your location
- Read active warnings first. Follow the protective action for your location. An app image cannot cancel a warning.
- Confirm what you opened. Check the product name, units, radar site, scan time, and elevation angle. Use an observed frame rather than a future-radar projection. The NWS radar viewer provides a starting point for exploring official radar data.
- Locate the storm in reflectivity. Play several frames to follow the precipitation core and leading edge. A bowed shape describes storm structure. Our derecho, bow echo, and squall line guide explains why radar shape alone does not establish the damaging-wind footprint.
- Compare matching velocity data. Use the same radar and tilt, with scan times as close as available. Find the radar on the map and read the legend before interpreting wind shifts or a compact circulation. Compare base and storm-relative velocity if both are available.
- Check what was measured at the surface. Nearby observations and your station can add context once you are safely sheltered. Compare times carefully. A radar velocity value aloft and a gust at one exposed sensor are different measurements.
For example, a bright reflectivity core over your map pin with little gauge rainfall could involve hail, melting precipitation, or rain that has not reached your location. A strong wind at your station with weak radial velocity could reflect cross-beam motion or a shallow gust below the sampled beam. These are explanations to investigate, not reasons to dismiss a warning or assume that either instrument failed.
You do not need to classify every radar pattern to use the information well. Identify the product, watch its recent trend, recognize its limits, and follow official warnings. The official severe-thunderstorm criteria explain why vivid radar colors alone do not determine a storm’s classification.
Frequently asked questions
Does red and green together always mean a tornado?
The answer is no. A broad red and green split can come from ordinary wind crossing the radar site. Compact opposing velocities may indicate rotation, but the measured speeds, geometry, beam height, and data quality matter. Tornado warnings do not require ground confirmation before you act.
Does high dBZ mean stronger wind?
The answer is no. dBZ describes echo strength, while velocity describes motion along the beam. A bright reflectivity core may accompany dangerous weather, but its dBZ value is not a wind speed or a tornado rating.
Which color is inbound on radar?
On common U.S. velocity palettes, green or blue is toward the radar and red or orange is away. Custom palettes can differ, so check the legend.
Can velocity show wind speed at my house?
The connection is not direct. It samples one component of target motion within a volume aloft. Beam height, viewing angle, and the difference between air motion and target motion limit direct surface comparison.
Why is velocity blank where reflectivity is visible?
Signal quality may be too low for a reliable Doppler estimate, the product range may be shorter, filtering may remove targets, or the display may be missing data. The products have different quality requirements.
Sources and further reading
- NWS glossary: Reflectivity and reflectivity factor
- NWS spotter glossary: dBZ and why high values do not confirm severe weather
- NWS Milwaukee: Radar measurements, velocity colors, and non-weather targets
- NWS Raleigh: Reflectivity and Doppler velocity basics
- NWS meteorology tutorial: Velocity aliasing and range folding (PDF)
Sources checked September 5, 2026. About the WXObservation team and our editorial approach.