
Why Does My Weather Station Differ From My Weather App?
A backyard station measures one exposure at one time. A phone app may show a distant observation, a forecast grid, or a derived value. The numbers can differ without either source being broken—but the pattern can also reveal a real station problem.
First determine whether the app value is an observation or a forecast, where it comes from, and when it was valid. Then compare the same variable, units, and timestamp. Differences often come from distance, elevation, terrain, ground cover, buildings, sensor height, update timing, and formulas for sea-level pressure or “feels like” values. Calibrate only after a repeatable sensor bias remains under fair comparisons.
Observation and forecast are different products
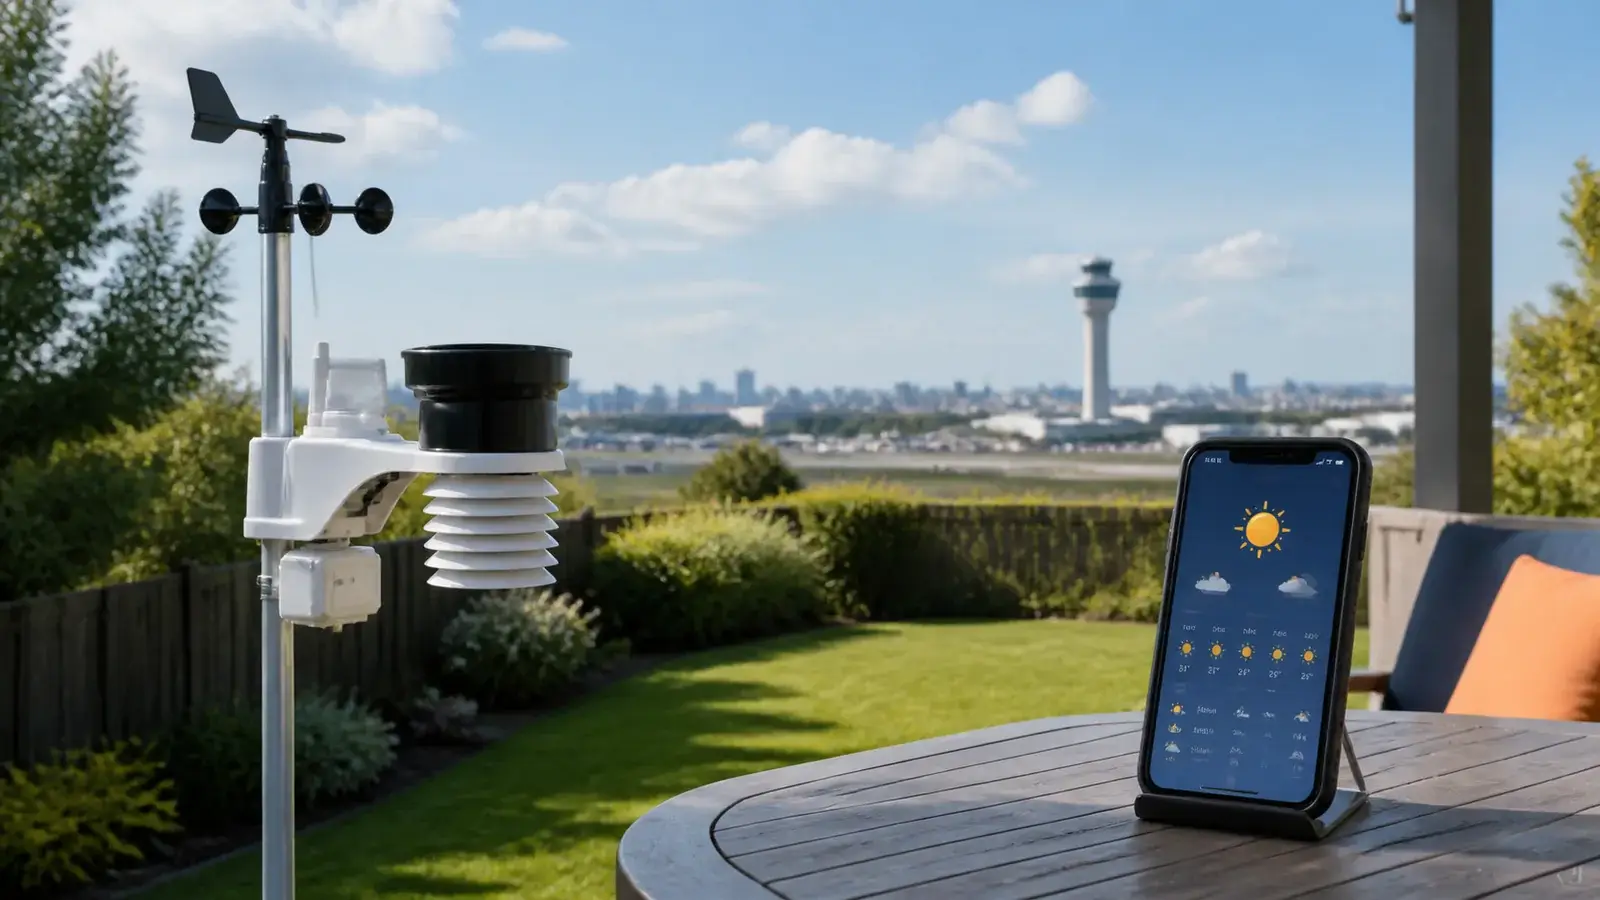
A personal weather station observes conditions at its sensors. A weather app may display several products on one screen: the latest observation, the forecast for the current hour, a radar-derived estimate, a model value interpolated to your location, or a proprietary “feels like” calculation. A precise-looking number does not guarantee that it was measured in your neighborhood.
Usually reports current or recently sampled conditions at one backyard exposure. The result depends on siting, maintenance, calibration, sensor design, and local microclimate.
May blend observations, forecast models, radar, satellite data, and algorithms. Its “current” value may be a forecast grid or a report from a station miles away.
Why each weather field can disagree
| Field | Common legitimate differences | Possible station problem |
|---|---|---|
| Temperature | Elevation, shade, wind, ground cover, urban heat, valley cooling, different valid time | Direct sun, warm wall or roof, poor shield airflow, wrong channel, stable sensor bias |
| Humidity | Different temperature and air mass, RH changes as temperature changes | Contaminated sensor, condensation, poor exposure, slow response |
| Dew point | Calculated from local temperature/RH. App uses a different source | Bad temperature or humidity input propagates into dew point |
| Wind | Height, terrain, trees, buildings, gust timing, averaging period | Blocked cups, wrong north alignment, turbulent roof site, loose mount |
| Rain | Rainfall varies sharply over short distances, different reset windows | Blocked or unlevel gauge, wind undercatch, stuck tip mechanism, app upload gap |
| Pressure | Station vs sea-level pressure, elevation method, update time | Wrong elevation, units, mode, or offset |
| Feels like | Different heat-index, wind-chill, solar, or apparent-temperature formulas | Usually compare the input temperature, humidity, and wind before the derived value |
A fair seven-check comparison
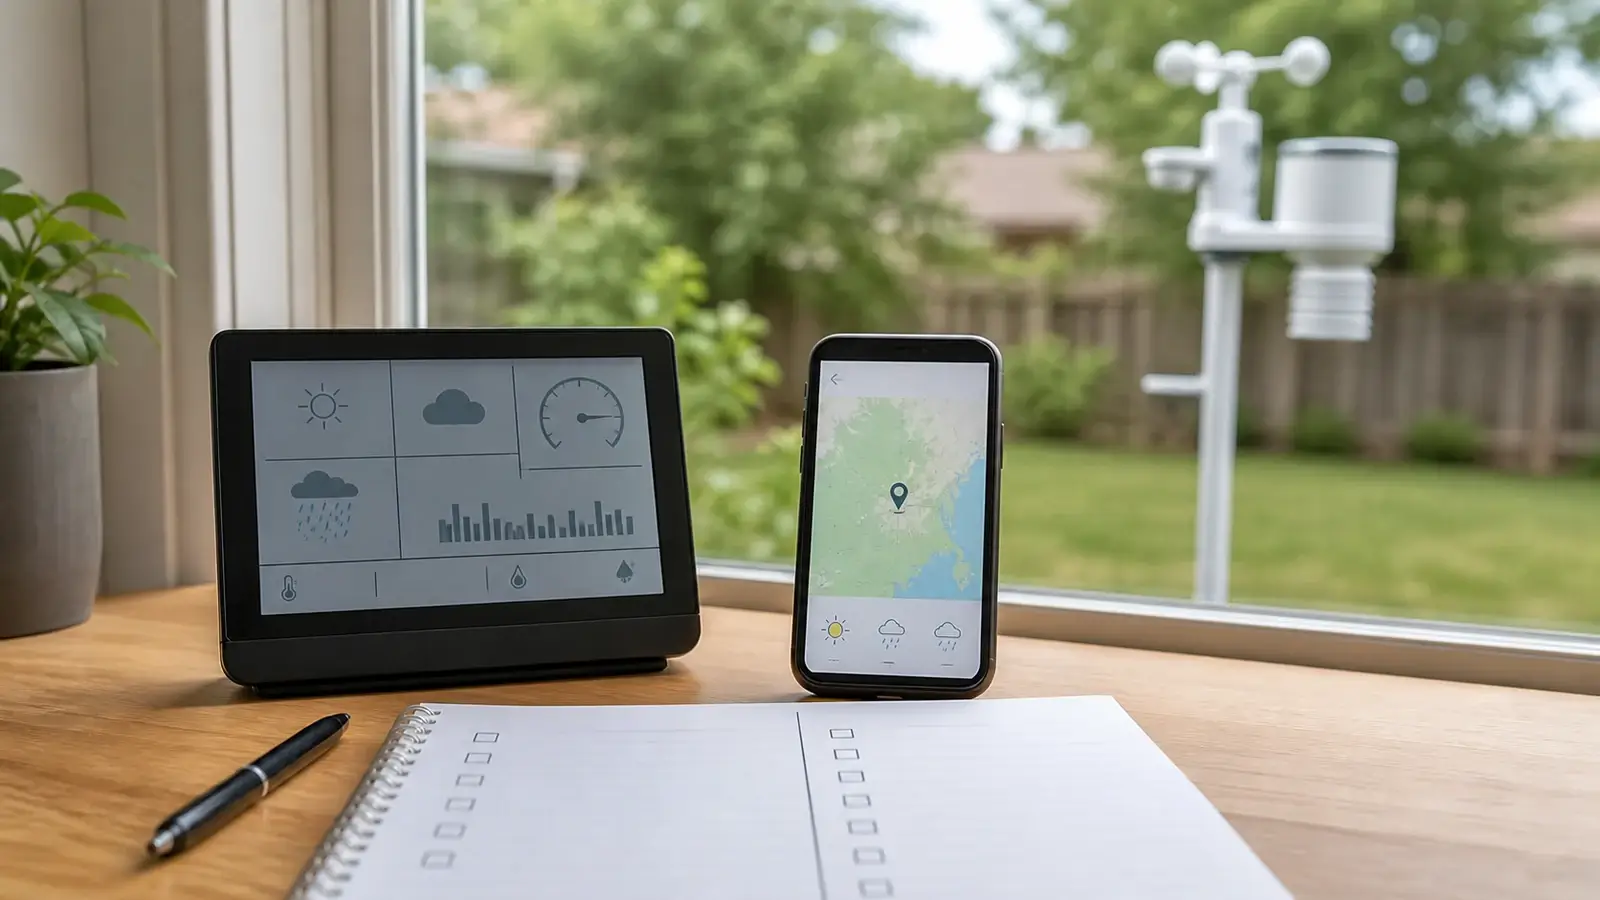
Name the exact field
Compare air temperature with air temperature, not heat index, apparent temperature, a daily high, or an hourly forecast. For pressure, identify station versus sea-level value.
Find the app’s source
Look for a station name, map layer, provider, “observed” label, or forecast valid time. If the source is not disclosed, treat an exact calibration comparison cautiously.
Match timestamps
A home console may refresh seconds after a sample while an app observation can be several minutes old. Compare archived or clearly timestamped values when conditions are changing.
Match units and definitions
Confirm °F/°C, mph/km/h/knots, inHg/hPa, rainfall interval, wind average, gust window, and pressure type.
Compare location and elevation
Check distance, elevation, terrain, water, land cover, and urban development. The nearest station is not automatically the most representative.
Inspect your exposure
Look for sunlight, walls, roofs, pavement, trees, overhangs, vents, unstable mounting, dirty sensors, and recent maintenance or relocation.
Look for a repeated pattern
Track both sources over several conditions. A changing difference often reflects exposure or timing, a stable bias under fair conditions may justify calibration.
What the pattern tells you
Investigate temperature shielding, surfaces, and airflow. Compare again after sunset or under solid overcast.
Valley cooling, frost, terrain, shade, and observation timing can create real local differences. Verify timestamps before adjusting.
The values may be the same event shifted by refresh or upload delay. Compare a short time series rather than single tiles.
You are probably comparing station pressure with a sea-level value or using the wrong entered elevation.
Local variability and wind exposure may be responsible. Check the gauge, then compare several events before calibration.
Look for sensor reception or upload failure rather than separate accuracy problems in every instrument.
The app should not become the target that every sensor is forced to match. Use it as one clue. A nearby maintained observation with known exposure and timestamp is a better reference, and a co-located calibrated instrument is better for some tests.
Which reading should you trust?
Trust depends on the question. For the temperature beside your garden, a well-shielded backyard sensor may be more relevant than the airport. For an official climate record, aviation operation, flood decision, or warning, use the appropriate official observation and guidance. For a neighborhood comparison, inspect several sources and their metadata.
- Trust your station’s trend more after its siting, maintenance, clock, units, and sensor link have been checked.
- Trust an app’s official warning even when your property has not yet experienced the hazard.
- Use dew point rather than relative humidity alone when comparing how much moisture is present, but verify both stations’ temperature/RH inputs.
- Use sea-level pressure for regional weather-pattern comparison and station pressure for actual pressure at the sensor elevation.
- Keep notes when moving, cleaning, calibrating, or replacing hardware so changes in the record have an explanation.
If a repeatable bias remains, follow the calibration procedure for that sensor and model. Adjust one variable at a time, preserve the old setting, and verify the result through changing conditions.
Frequently asked questions
Why is my home weather station temperature different from my phone?
The phone may show a forecast or distant observation, while your sensor measures one backyard exposure. Compare the source, timestamp, elevation, shade, ground cover, and units before calibrating.
Is a personal weather station more accurate than a weather app?
It can be more representative of your property when it is well sited and maintained. The app is stronger for regional forecasts, radar context, and official warnings. They answer different questions.
Why does my weather station show different pressure?
The station may show actual station pressure while the app shows pressure reduced to sea level. At elevation those values should differ. Confirm the field before applying an offset.
Should I calibrate my station to match the app?
Not from one comparison. Use matching observations from a known source and time, inspect siting and maintenance, and look for a stable bias across several conditions.
Sources and further reading
These primary and manufacturer references support the definitions, diagnostic steps, and limitations in this guide.
Australian Bureau of Meteorology: website and app differences — why values can differ across products and devices
National Weather Service/CWOP Official Guide for Personal Weather Stations — measurement quality, siting, comparison, and performance guidance
National Weather Service/CWOP Personal Weather Station Siting Guide — exposure, radiation shielding, rain-gauge and wind-sensor placement
National Weather Service pressure definitions — station pressure and sea-level pressure distinctions
Model controls and reset sequences vary. Use the current manual for your exact console, sensor, hardware revision, and radio region before changing calibration, power, pairing, or network settings.